Dashboard
The Dashboard gives you an at-a-glance summary of your business performance. Panels shown are based on your assigned permissions — if you don't have access to a particular module (e.g. Finance, Scheduling), its panel will not appear.
Overview: Layout and permission-based panels shown on the Dashboard
Overview
- Log on to Chillhub App
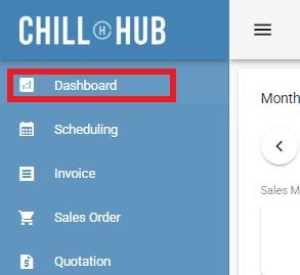
- The Dashboard is the default landing page, or navigate via Menu → Dashboard
- Panels are arranged as expandable cards. Each panel can be collapsed or expanded using the panel header.
- The following panels may appear depending on your permissions:
- Monthly Metrics – Sales & Financial KPIs (requires Dashboard Sales Data and/or Dashboard Financial Data permission)
- Pending Jobs – Today's/selected date's scheduled jobs (requires Dashboard Pending Job permission)
- Sales Month Summary – 6-month rolling invoice/sales order chart (requires Dashboard Sales Data permission)
- Sales Day Summary – 7-day rolling invoice/sales order chart (requires Dashboard Sales Data permission)
- Top Product – Best-selling products for the month (requires Dashboard Top Product permission)
- Top Action – Best-selling services for the month (requires Dashboard Top Service permission)
- Employee Summary – Sales performance by employee (requires Dashboard Employee Summary permission)
- Team Summary – Sales performance by team (requires Dashboard Team Summary permission)

Monthly Metrics: Sales and financial KPIs for the selected month
Monthly Metrics

- / : Navigate to the previous/next month.
- Sales Metrics (shown if you have Dashboard Sales Data permission)
- Total Sales: Combined total of billed (invoiced) and unbilled (sales order) amounts for the month.
- Total Receivables: Total Sales minus any amount already paid.
- Total Billed: Total amount from Invoices raised in the month.
- Total Unbilled: Total amount from Sales Orders not yet invoiced in the month.
- Financial Metrics (shown if you have Dashboard Financial Data permission)
- Total Revenue: Total revenue recognized for the month, from the Profit & Loss data.
- Cost of Goods Sold (COGS): Total cost of goods sold, including cost adjustments, for the month.
- Total Expenses: Total operating expenses recorded for the month.
- Gross Profit: Total Revenue less COGS.
- Net Profit: Gross Profit less Total Expenses.
- Gross Profit Margin: Gross Profit as a percentage of Total Revenue.
- Net Profit Margin: Net Profit as a percentage of Total Revenue.
Pending Jobs: Scheduled jobs for a selected date, with quick actions
Pending Jobs

- Date Picker: Select the date to view scheduled jobs for.
- Filter Team: Filter the job list by a specific team, or view all teams.
- Print: Print the current list of pending jobs.
- Job Card: Each job displays:
- Time: Scheduled start and end time.
Shows “(In Progress)” if the job has been started. - Customer: Customer name, contact number, and delivery address (uses delivery info if it differs from billing).
- Team: The assigned team, if any.
- Tasks: List of tasks assigned to the job.
- Delivery Note No.: Linked delivery order, if any.
- Remark: Any notes for the job.
- Delivery Items: Products and quantities to be delivered for this job.
- : Open a WhatsApp chat with the customer (disabled if no contact number).
- : Open the customer's address in Google Maps.
- Edit: Open the job in the Scheduling form.
- Attach File: View or upload files/photos related to the job.
- Start: Record the job's start time (disabled once already in progress).
- Complete: Record the job's completion time.
- Daily notes (non-job entries) are displayed as a header line with a remark, without the action buttons above.
Sales Summary: Rolling monthly and daily sales/invoice charts
Sales Month Summary

- / : Shift the chart back/forward by 6 months.
- Amount / Count toggle: Switch the chart between showing monetary totals or transaction counts.
- Chart bars are stacked and grouped as:
- Paid (Billed) / Unpaid (Billed): Based on Invoices.
- Paid (Unbilled) / Unpaid (Unbilled): Based on Uninvoiced Sales Orders.
Sales Day Summary

- / : Shift the chart back/forward by 7 days.
- Amount / Count toggle: Switch the chart between showing monetary totals or transaction counts.
- Uses the same Paid/Unpaid, Billed/Unbilled grouping as the Sales Month Summary chart above.
Top Product & Top Action: Best-selling products and services for the month
Top Product

- / : Navigate to the previous/next month.
- Select Industry: Filter results to a specific industry, or view all industries.
- Amount / Count toggle: Rank products by total sales amount or by number of orders.
- Data Table: Lists products with their corresponding amount or order count for the month.
- Export to Excel: Export the current Top Product list to an Excel file.
Top Action

- / : Navigate to the previous/next month.
- Select Industry: Filter results to a specific industry, or view all industries.
- Amount / Count toggle: Rank services by total sales amount or by number of orders.
- Data Table: Lists services with their corresponding amount or order count for the month.
- Export to Excel: Export the current Top Action list to an Excel file.
Employee & Team Summary: Sales performance grouped by employee or team
Employee Summary

- / : Navigate to the previous/next month.
- Amount / Count toggle: Show transaction total amount or counts per employee.
- Data Table: Breaks down each employee's Invoice, Sales Order, Quotation, Job, and Purchase Order totals for the month.
- Export to Excel: Export the current Employee Summary to an Excel file.
Team Summary

- / : Navigate to the previous/next month.
- Amount / Count toggle: Show transaction total amount or counts per team.
- Data Table: Lists each team's total sales amount or count for the month.
- Export to Excel: Export the current Team Summary to an Excel file.