Dashboard
The Dashboard gives you an at-a-glance summary of your business performance. Panels shown are based on your assigned permissions — if you don't have access to a particular module (e.g. Finance, Scheduling), its panel will not appear.
Overview: Layout and permission-based panels shown on the Dashboard
Overview
- Log on to Chillhub App
- The Dashboard is the default landing page, or navigate via Menu → Dashboard
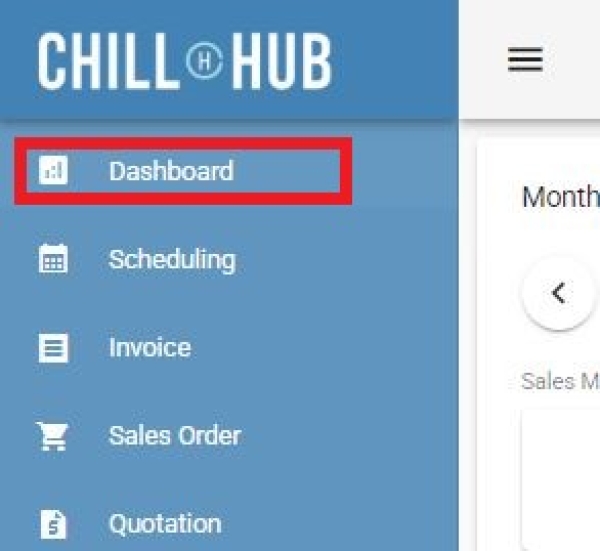
- Panels are arranged as expandable cards. Each panel can be collapsed or expanded using the panel header.
- The following panels may appear depending on your permissions:
- Monthly Metrics – Sales & Financial KPIs (requires Dashboard Sales Data and/or Dashboard Financial Data permission)
- Pending Jobs – Today's/selected date's scheduled jobs (requires Dashboard Pending Job permission)
- Sales Month Summary – 6-month rolling invoice/sales order chart (requires Dashboard Sales Data permission)
- Sales Day Summary – 7-day rolling invoice/sales order chart (requires Dashboard Sales Data permission)
- Top Product – Best-selling products for the month (requires Dashboard Top Product permission)
- Top Action – Best-selling services for the month (requires Dashboard Top Service permission)
- Employee Summary – Sales performance by employee (requires Dashboard Employee Summary permission)
- Team Summary – Sales performance by team (requires Dashboard Team Summary permission)

Monthly Metrics: Sales and financial KPIs for the selected month
Monthly Metrics

- / : Navigate to the previous/next month.
- Sales Metrics (shown if you have Dashboard Sales Data permission)
- Total Sales: Combined total of billed (invoiced) and unbilled (sales order) amounts for the month, including Sales and Service Tax
- Total Receivables: Total Sales minus any amount already paid.
- Total Billed: Total amount from Invoices raised in the month, including Sales and Service Tax
- Total Unbilled: Total amount from Sales Orders not yet invoiced in the month, including Sales and Service Tax
- Financial Metrics (shown if you have Dashboard Financial Data permission)
- Total Revenue: Total revenue recognized for the month, from the Profit & Loss data, excluding Sales and Service Tax
- Cost of Goods Sold (COGS): Total cost of goods sold, including cost adjustments, for the month.
- Total Expenses: Total operating expenses recorded for the month.
- Gross Profit: Total Revenue less COGS.
- Net Profit: Gross Profit less Total Expenses.
- Gross Profit Margin: Gross Profit as a percentage of Total Revenue.
- Net Profit Margin: Net Profit as a percentage of Total Revenue.
Pending Jobs: Scheduled jobs for a selected date, with quick actions
Pending Jobs

- Date Picker: Select the date to view scheduled jobs for.
- Show Completed: Toggle whether completed jobs are included in the list for the selected date.
- Filter Team: Filter the job list by a specific team, or view all teams.
- Print: Print the current list of pending jobs.
- Job Card: Each job displays:
- Time: Scheduled start and end time.
Shows “(In Progress)” if the job has been started. - Customer: Customer name, contact number, and delivery address (uses delivery info if it differs from billing).
- Team: The assigned team, if any.
- Tasks: List of tasks assigned to the job.
- Delivery Note No.: Linked delivery order, if any.
- Remark: Any notes for the job.
- Delivery Items: Products and quantities to be delivered for this job.
- : Open a WhatsApp chat with the customer (disabled if no contact number).
- : Open the customer's address in Google Maps.
- Edit: Open the job in the Scheduling form.
- Attach File: View or upload files/photos related to the job.
- Start: Opens the Start Job dialog to record the job's start time. (disabled once already in progress)
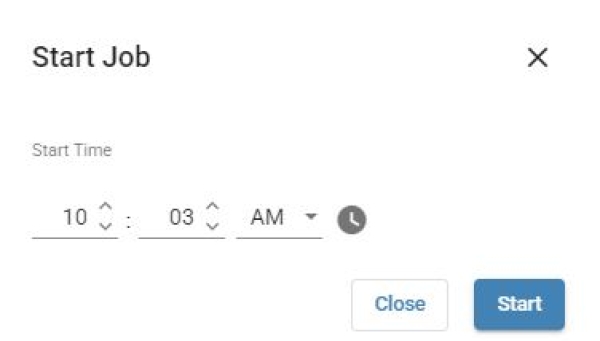
- Start Time: Defaults to the current time; adjust if needed.
- Click Start to confirm.
- Complete: Opens the Complete Job dialog to record the job's completion time and progress.
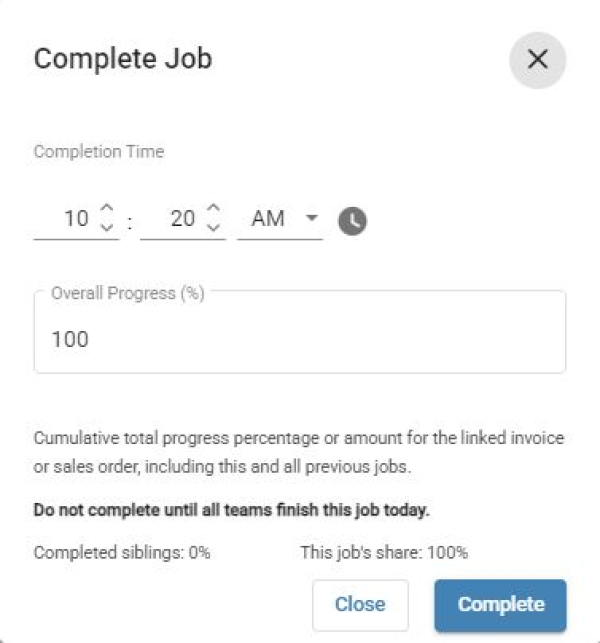
- Complete Time: Defaults to the current time; adjust if needed.
- Source: Shows the linked invoice or sales order number, if any.
- Overall Progress (%): The cumulative progress of the linked invoice or sales order across all its jobs, including this one and any before it. Defaults to the completed siblings' progress plus this job's calculated share, capped at 100%.
- Do not complete until all teams finish this job today.
- Shows Completed siblings (the combined progress already completed by earlier jobs linked to the same invoice/sales order) and This job's share (the portion attributed to this job, calculated as Overall Progress minus Completed siblings).
- Click Complete to confirm.
- Daily notes (non-job entries) are displayed as a header line with a remark, without the action buttons above.


Sales Summary: Rolling monthly and daily sales/invoice charts
Sales Month Summary

- / : Shift the chart back/forward by 6 months.
- Amount / Count toggle: Switch the chart between showing monetary totals or transaction counts.
- Chart bars are stacked and grouped as:
- Paid (Billed) / Unpaid (Billed): Based on Invoices.
- Paid (Unbilled) / Unpaid (Unbilled): Based on Uninvoiced Sales Orders.
Sales Day Summary

- / : Shift the chart back/forward by 7 days.
- Amount / Count toggle: Switch the chart between showing monetary totals or transaction counts.
- Uses the same Paid/Unpaid, Billed/Unbilled grouping as the Sales Month Summary chart above.
Top Product & Top Action: Best-selling products and services for the month
Top Product

- / : Navigate to the previous/next month.
- Select Industry: Filter results to a specific industry, or view all industries.
- Amount / Count toggle: Rank products by total sales amount or by number of orders.
- Data Table: Lists products with their corresponding amount or order count for the month.
- Export to Excel: Export the current Top Product list to an Excel file.
Top Action

- / : Navigate to the previous/next month.
- Select Industry: Filter results to a specific industry, or view all industries.
- Amount / Count toggle: Rank services by total sales amount or by number of orders.
- Data Table: Lists services with their corresponding amount or order count for the month.
- Export to Excel: Export the current Top Action list to an Excel file.
Employee & Team Summary: Sales performance grouped by employee or team
Employee Summary

- / : Navigate to the previous/next month.
- Amount / Count toggle: Show transaction total amount or counts per employee.
- Data Table: Breaks down each employee's Invoice, Sales Order, Quotation, Job, and Purchase Order totals for the month.
- Export to Excel: Export the current Employee Summary to an Excel file.
Team Summary

- / : Navigate to the previous/next month.
- Amount / Count toggle: Show Allocated Sales as a total amount, or as a count of jobs, for each team.
- Data Table: Lists each team's:
- Hours Planned: Total scheduled job hours for the team.
- Hours Actual: Total actual job hours recorded (from Start/Complete times) for the team.
- Labor Cost (Planned): Total labor cost based on planned hours and the team's hourly rate.
- Labor Cost (Actual): Total labor cost based on actual hours and the team's hourly rate.
- Allocated Sales / Count: Total allocated sales amount, or number of jobs, depending on the Amount/Count toggle.
- Export to Excel: Export the current Team Summary to an Excel file.